Posts Tagged 'google analytics'

Introduction to Web Analytics and AdWords

Last week I gave a guest lecture to the students of Digital Marketing and Social Media course, at which I serve as assistant lecturer (to Lior Zoref).

It is the first time the course is being offered at The College of Management, and the topics cover most aspects of the discipline, including social networks, micro-blogging and blogging, online advertising, web analytics, location based, video and more. Our goal is to provide the students (all of whom working in marketing departments and ad agencies) with the understanding of what tools and platforms are available, and what is the best way to leverage them.

My lecture focused on the fundamentals of web analytics and Google AdWords platforms. The presentation I used is embedded below and can be downloaded from my slideshare page (recommended – have embedded videos and animation). Replay of the lecture (in Hebrew) can be viewed on Lior Zoref’s uStream. Comments are welcome.

Learning Sharepoint and Web Analytics

3 days into my new job at IntLock and I have lots of items in my To-Do list, the most important ones are a) learning how Sharepoint is built (from an architecture point of view, web-parts and all) and b) terms and definitions relating to web analytics. Getting to know IntLock and CardioLog goes without saying…

IntLock was founded is 2005 and operates in the web analytics scene. Our solution (video), CardioLog, is considered one of the leading Sharepoint Usage Reporting solutions. CardioLog integrates with the portal structure (tree) and ‘knows’ its content and metadata as well – thus enabling us to present an accurate snapshot of your website: customer site (B2C), partner/agents site (B2B) and employee portal (intranet). CardioLog can also pull data from your AD (active directory) to provide a deeper understanding of how your users (and groups) access the site.

CardioLog comes in 3 flavors: Lite (free), Professional and Enterprise. The main differences are outlined in the table below, along with cost of course. The main diffrentiators are what reports come out-of-the-box, the # of page views per month supported and # of years saved for hostory data. Wanna build your own reports? Get your copy of our SDK and start building. You welcome to download CardioLog Lite for free right now, and start making sense (and $$$) of your traffic. You can also download a free 30-day trial of our Enterprise Edition, with more features and reports. As always, we’re here to help.

CardioLog offers much more than the built-in Sharepoint 2007 Reporting, and is also an excellent alternative for Google Analytics. Here’s what made the difference for some of our customers:

  • Independent JavaScript agent
  • Data aggregation according to portal hierarchy (not URL-based)
  • Data filtering according to portal metadata
  • Tracking of portal-specific user activities
  • Visitor segmentation by Active Directory attributes
  • Exporting reports to SharePoint 2007 web parts
  • Built-in integration with other enterprise applications (e.g., CRM, ERP)

While you’re downloading CardioLog and analyzing traffic, I’ll get back to my reading: Web Analytics – An Hour A Day, by Avinash Kaushik for now (1 hour per day) and some Sharepoint tutorials and blogs for later. If you have any favorite blogs, tweeple or sites, comment away 🙂

Reblog this post [with Zemanta]

Twitter/Facebook gave me 1000% boost

Relax, not me personally, my blog got that boost.
With June (and 2Q) wrapping up last week, it’s an excellent time to gather some statistics around my blog, and I decided to make a comparison to the previous period, and maybe identify some trends. The period I looked at is 1H08 vs. 1H09.

Google Analytics is truly a powerful tool, and I was able to go very deep (drill-down) and round up some interesting figures. I wanted to verify 2 assumptions I made since Jan 2008:

The results supported both assumptions.
Traffic-wise, the first 6 months of 2009 generated 13,004 visits and 18,660 page views, almost twice than the 2008 period. The increase was expected, but the sources breakdown amazed me. I have a 3-step process for pushing my blog’s content: update my twitter, post to facebook and save to del.icio.us – between those 3 networks I cover almost 5,000 eyeballs (directly). It did the trick, big time!
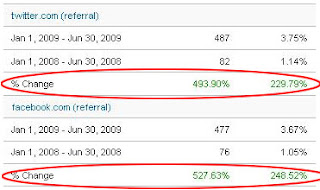
Facebook generated 5 times more visits – 76 in 1H08 to 480 in 1H09, and twitter generated roughly the same growth – 82 in 1H08 to 490 in 1H09. Direct traffic from Google also increased, by 110%, from 2,800 in 1H08 to 6,030 in 1H09.

Location-wise, I got 3 times more visits from Israel, jumping from 930 in 1H08 to just under 3,000 in 1H09. The US remains my main source of readers, with 4,050 visits in 1H09 (comapred to 2,700 in 1H08). The EU were also loyal readers, with +50% increase in France, UK, Germany, Netherlands and Italy. Australia, India and Canada showed similar increases.

To be honest, I expected those results. With the explosion of new media, facebook, twitter, friendfeed and others, I would be surprised to see a lower figure from those 2 sources, especially when taking into account the amount of self-marketing I did these past 18 months.

Looking into the near future, I wonder what my 1H10 vs 1H09 will look like.. what source will show the most increase in visits? will blogs still rule the world or will we all lifestream our lives? What do you think?


Mobile & Media Consultant. I help startup companies launch products to the consumer market. Reach out: dvir.reznik [at] gmail.com
Website
About

Archives

Disclaimer

This is my personal blog. The postings here do not represent the thoughts, intentions, plans or strategies of my past employers or of my clients. It is solely my opinion.